Sweet Online Retail Index

FREE ACCESS
It's free and easy to start
You don't need a credit card as the service is completely free. We've made the service freely available to ensure the information is accessible for small and medium sized businesses, and to encourage more organisations to join us. The more data that flows into the index, the more accurately you will be able to compare your performance with the entire market or chosen sector.
MARKET OVERVIEW
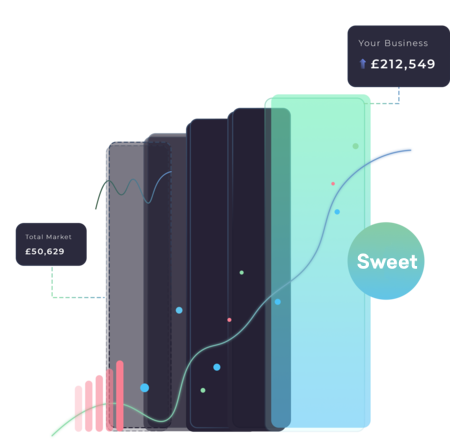
Powerful insights
Sweet Online Retail Index tracks Sales, Average Order Value, Units per Order and Average Item Selling Price and allows you to see UK sales trends at market, sector, and sub sector level in an instant. You'll be able to context your performance by comparing your business growth rate to others in your sector, providing you with the insights to make more informed business decisions.
ISO 27001 CERTIFIED
Putting data security first
Your data security is our primary concern. Sweet Online Retail Index is completely anonymous and reports at sector and sub sector level. Sweet Analytics is certified to ISO 27001, so you can be confident that our processes are compliant, and your data is protected and completely secure at all times.
Key Features
Learn what makes our Sweet Online Retail Index so powerful.
Ecommerce Metrics
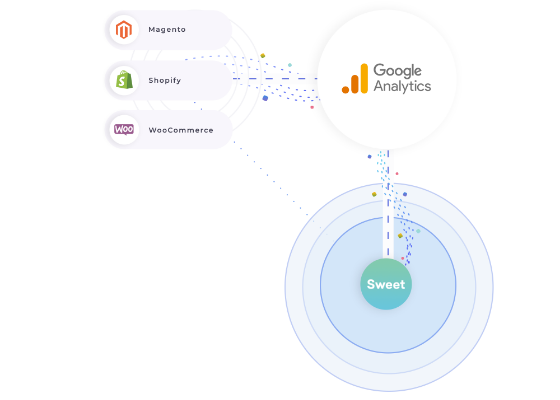
Connecting to your ecommerce store is just a few clicks away

Sweet Online Retail Index tracks four key metrics Sales, Average Order Value, Units per Order and Average Item Selling Price. Easily compare your own growth rates to your sector and sub sector. See which sectors are the fastest growing.
Google Analytics Metrics

Input your Google Analytics details today for instant visibility. We track 3 key metrics: sessions, bounce rate, and conversion rate. You are able to benchmark your own performance against your sector and sub sector key website metrics and then use this information to improve your own performance.
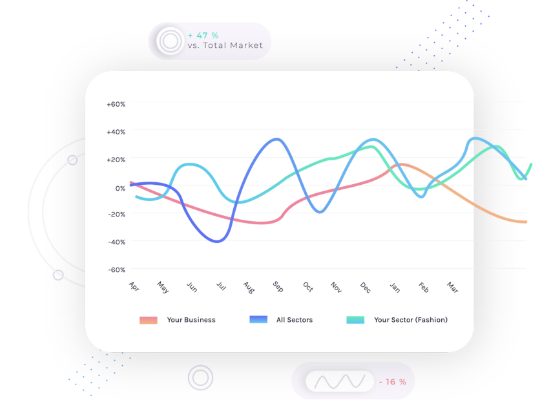
Sectors and Subsectors
To get maximum value from Sweet Online Retail Index you can compare your performance at sector and sub sector level over two years.

Unlike other benchmarking tools on the market, you can choose from a wide range of sectors and drill down to sub sector level, to increase the relevance of the benchmarking data.
Keep your team in the loop
Real time updates of market and sector data. Receive regular email reports automatically. No limit on number of users.

Sweet Online Retail Index gives you and your team unlimited user access to sales, average order value and other key metrics by sector and sub sector. We make it easy for you and your team to know what's happening in the market.
Frequently Asked Questions
Here are some of the most frequently asked questions. Contact us to learn more or simply try it yourself, it's free!
Get Started with Benchmark Index
Set up takes a few minutes and a world of insights awaits. Simply get started for free!